We've Had First Maps, Yes...
In Which: The HARD Board has problems that Districting can fix. The consultant tries to hide White people in an "Other" category. And we look at 5 maps--pick your favorite!
But What About Second Maps?
We’re coming to the end of Districting Season, and it’s been a while since we’ve peeked in on the HARD maps. They have 5 different Draft Maps they’re considering before they select the finalist on Monday September 16th. Before looking at the maps themselves, let’s explore specific reasons why the HARD districting process is important.
Parks Are For Everyone
If you’ve ever stepped on a grassy field or played on a playground in Hayward, you’ve used a HARD park. Their goal of having a park within a 15 minute walking distance of every home means they buy up spare plots of land everywhere and put parks on them. This map shows just how successful they’ve been in setting up parks throughout Hayward, Castro Valley, Fairview, Cherryland, San Lorenzo, and Ashland.
But if you’ve travelled around Hayward—into the hills, for example—then you know that not all parks are created equal. J. A. Lewis Park has a well-maintained grass area, a sand box, a playground, bathrooms, and water fountains. It’s so nice, delivery trucks stop there all the time to use the bathrooms. Compare that to the facilities at Memorial Park and you notice big disparities.
You’ll also notice that it breaks down in some pretty unsurprising ways: nicer parks tend to be in Castro Valley and in the Hayward Hills. Meanwhile parks in the flats are usually in worse condition and have fewer amenities, despite more people using them. From what gets built to how well they’re maintained, all of this is a choice from
The Least Representative Government Body
Taking a look at just Hayward—though HARD also includes Castro Valley, Cherryland, Fairview, San Lorenzo, and Ashland—White people make up about 14% of the population. And yet, if you look at the HARD Board of Directors, you’ll notice that it’s overwhelmingly white. This is one of the things that Districting is going to address.
But even if you ignore that—which you shouldn’t—looking at where the Directors live also highlights why some places may have better parks than others. The Directors all live in Castro Valley and the Hayward Hills. Nobody lives in the flats of Hayward, let alone in Cherryland or San Lorenzo.
In one of the most diverse cities in the United States it should be a little bit more representative, right? Surely someone—maybe someone from their Citizen’s Advisory Committee that only meets four times a year—would have run for office at some point. That’s part of the reason for resident Committees and Commissions, at least according to some elected officials.
About that…
HARD Doesn’t Hold Elections If They Can Help It
I wouldn’t vote Luis Reynoso for anything, but one thing he has done is force HARD to hold an election this year. HARD has been operating on a kind of gentleman’s agreement for decades when it comes to Board elections. Instead of holding open and democratic elections—far too expensive, they claim—they quietly appoint hand-picked candidates.
Nobody voted Sara Lamnin for HARD Board, for example. There was a vacancy and she was appointed by the existing board. The same goes for most of the other Directors. The 2020 election was likely the first time anyone had voted for a HARD Director in their memory.
Not only will having districts force HARD to hold more elections—though I have no doubt they’ll try their best to avoid it—it will also force the Board to be more representative of the area they serve. The process has already forced positive change: they’re streaming and recording their Public Hearings, which they haven’t done before July of this year. More government transparency, accessibility, and representation is inarguably positive.
To be clear, I don’t think the current Board nor its members are bad people. But I do think that the way they’ve operated has been undemocratic and unrepresentative and has caused disinvestment in our community. Compare the Cannery Park Splash Pad with the Castro Valley Park Splash Pad and tell me things are equal.
But The Maps Have To Be Good
When analyzing these maps, I noticed that the racial categories listed are Black, Asian, Latino, and Other. For the purposes of this article, I’m going to change “Other” to “White,” even though it may contain multi-racial or Pacific Islander people. As you’ll see, the largest “Other” areas are also the areas with the largest White population.
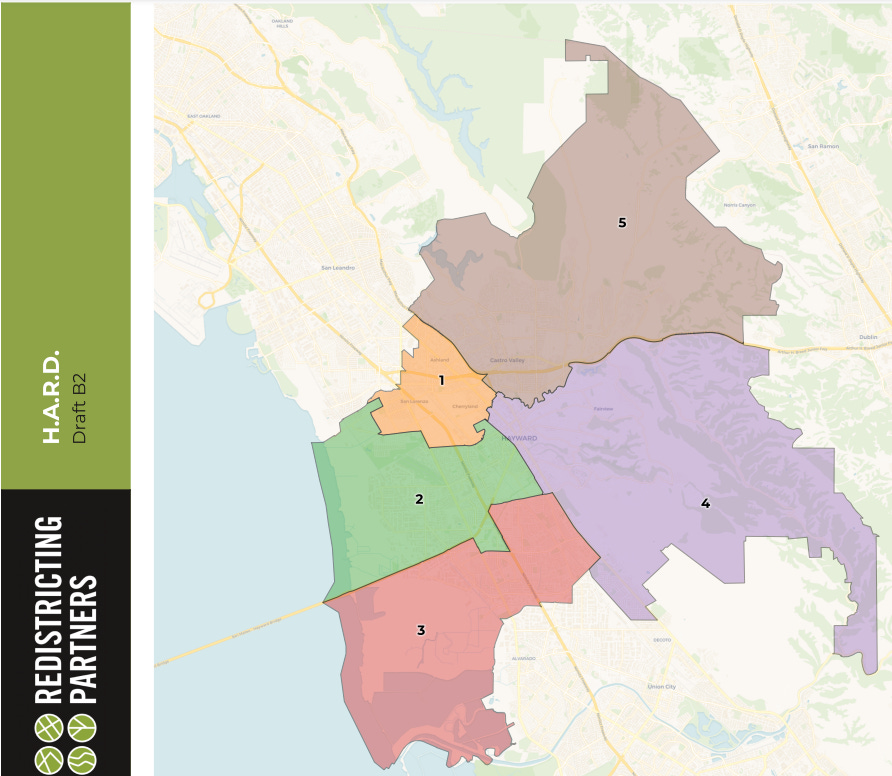
This map, like most of them, keeps Cherryland, Ashland, and San Lorenzo together in one district and puts Castro Valley together by itself in another district. It splits most of Hayward East to West and groups the Hills with Fairway Park. District 5 (Castro Valley) is overwhelmingly White (54% Citizen Voting Age Population [CVAP]). District 4 has a plurality of White voters (36%), while Districts 1, 2, and 3 have a plurality of Latine voters (between 33%-35%).
This effectively dilutes the Asian vote in Hayward, likely because it splits the higher Asian population areas of West Hayward along Highway 92. I would have difficulty believing Mr. Rafferty would agree to this one.
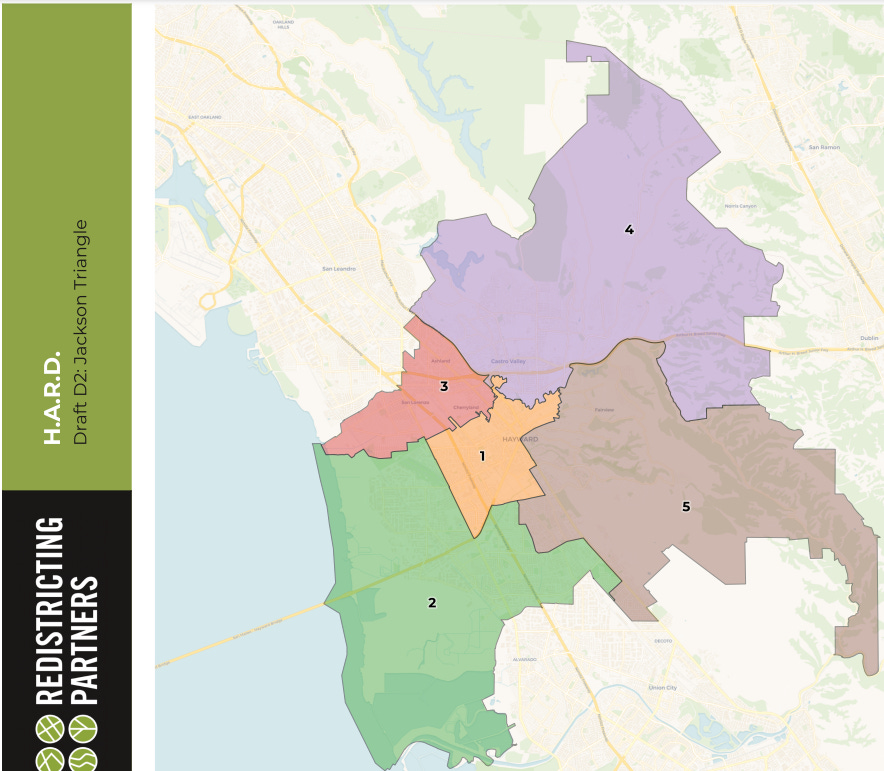
This map keeps Cherryland, San Lorenzo, and Ashland together and segregates Castro Valley by itself, too. But this map keeps most of West Hayward together, keeps Fairway Park in with the Hills, and groups Downtown and the Jackson Triangle together. It has a lot of similarities with the only Draft Map for the City.
Districts 1 and 3 are plurality Latine (36% and 34% CVAP), District 2 is plurality Asian (37% CVAP), and Districts 4 and 5 are mostly White (53% and 36% CVAP). This one is my favorite because it does a pretty good job of respecting neighborhood boundaries, maintains diverse voting majorities, and allows the northern unincorporated areas to have a seat on the Board.
This one divides Hayward from East to West into three pieces, which I’m not a big fan of. The unincorporated areas get rolled in with parts of Hayward, and Castro Valley eats part of Ashland and is divided along 580.
District 1 and 5 have pluralities of Latine voters (36% and 34% CVAP). District 4 is a near-even split between Asian and Latine voters (33% and 32%). Meanwhile District 3 is 50% White CVAP and District 2 is 41% White CVAP. This feels less representative and District 2 is even more White than similarly placed districts on other maps.
This map offers some changes around Castro Valley, Ashland, and the Hills. West Hayward is mostly preserved, and there’s a long district between 880 and Whitman or the BART tracks (it’s hard to tell).
Districts 1 and 2 are majority and plurality White (54% and 36% CVAP). Districts 3 and 5 are plurality Latine (36% and 35% CVAP) and District 4 is barely plurality Asian (33% CVAP) with Latine being 31% CVAP.
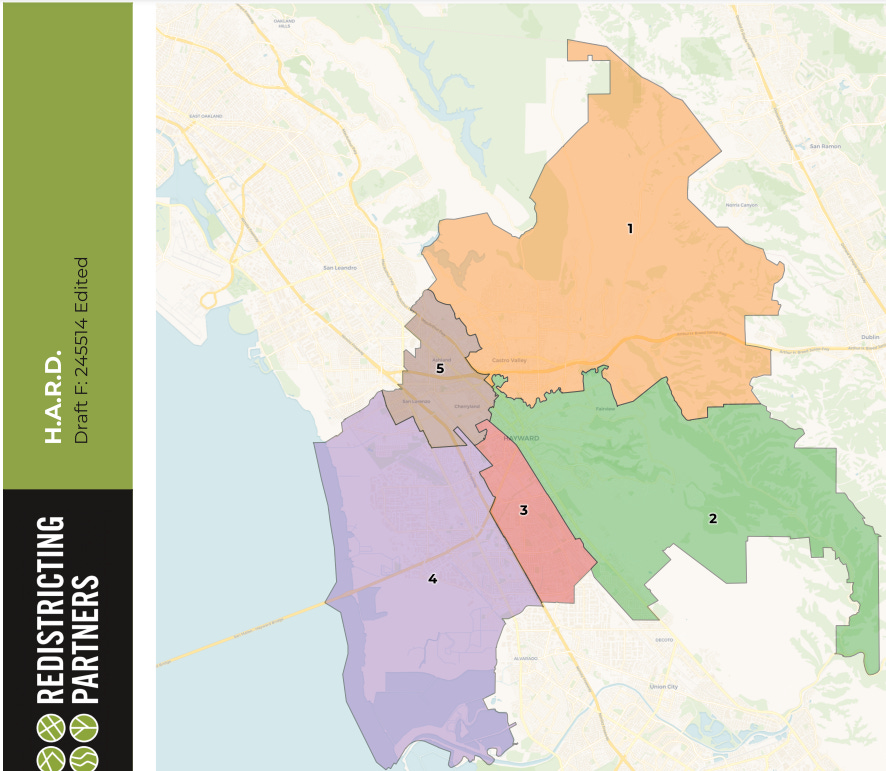
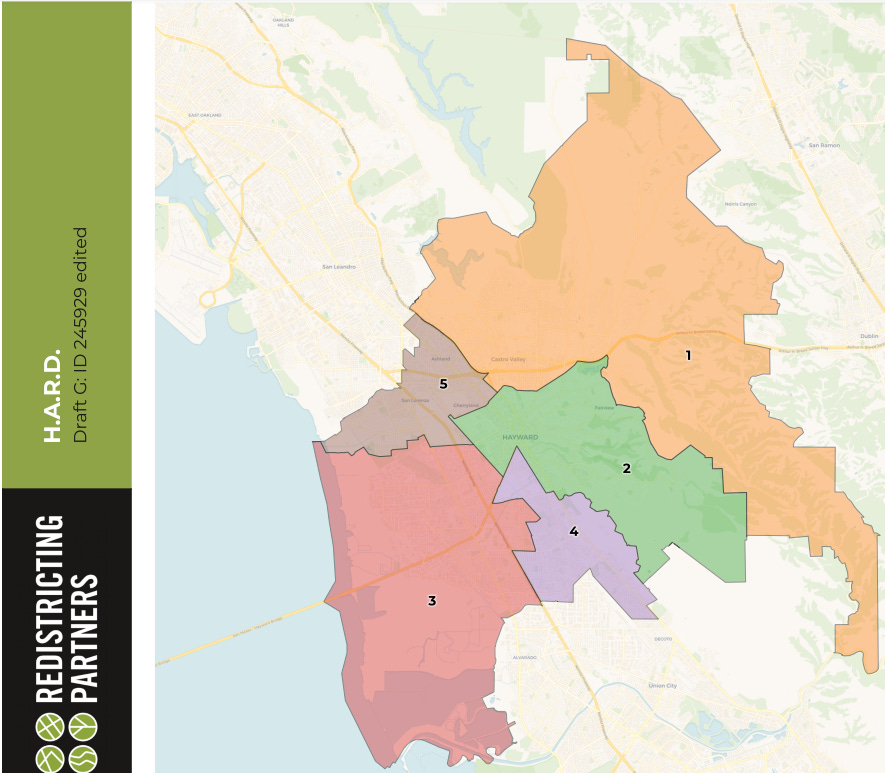
This one feels the most unhinged. Grouping the Jackson Triangle in with Fairway Park feels pretty messy as it’s not like the Golfing crowd walks the Eden Greenway often. It also lumps a lot of the flats with the hills in a weird way. The demographic splits don’t look great either.
District 1 is majority White (53% CVAP) and District 2 is plurality White (37% CVAP). District 3 is an even split between Asian and Latine voters (32% each). Then Districts 4 and 5 are plurality Latine (33% and 34%), though in District 5 there’s a close second for White voters (30%).
That’s a lotta maps! But the important thing to know is that you get a say in which one is chosen. Send HARD a comment about which map you like best—or which one you hate the least. Just make sure you do it by Monday September 16th. After that, they’ll choose the final map and we won’t have another chance until 2030.


